
Century 21 People’s Choice Realty Inc., Brokerage
120 MATHESON BLVD E #103
MISSISSAUGA, Ontario
L4Z 1X1


Brantford, Eagle Place West, N3S 2H1
$599,900
Listed by Re/Max Twin City Realty Inc..
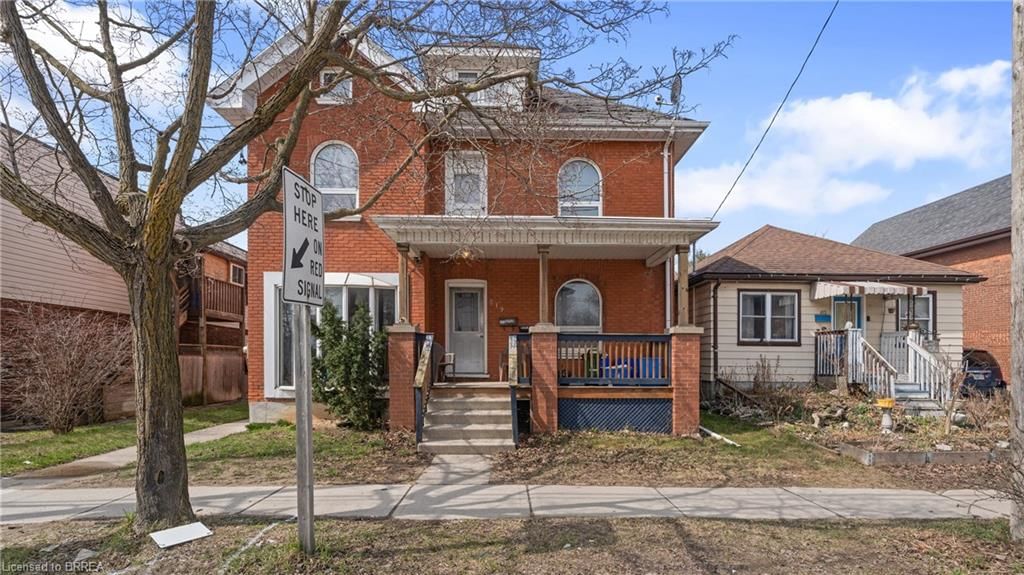
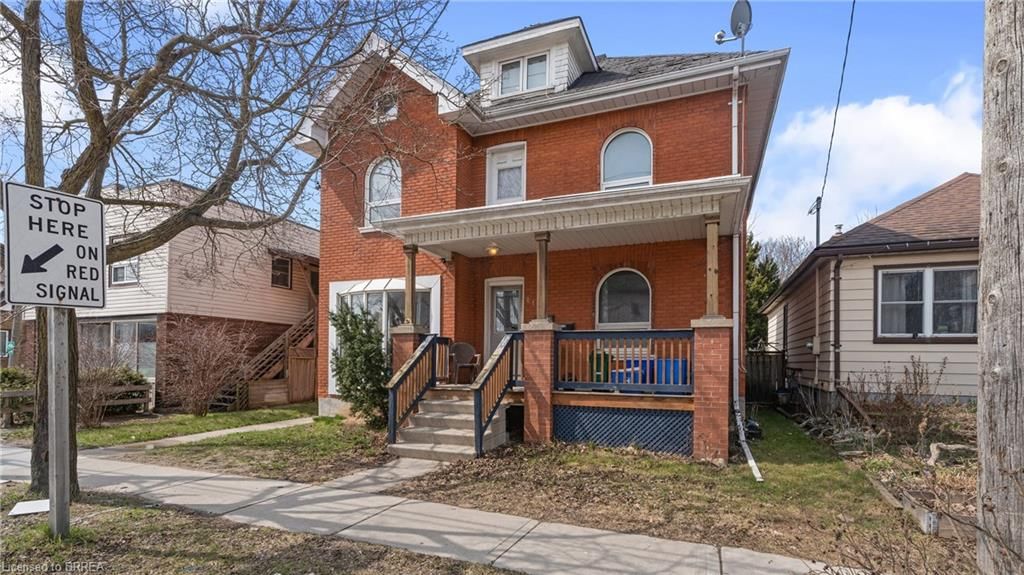
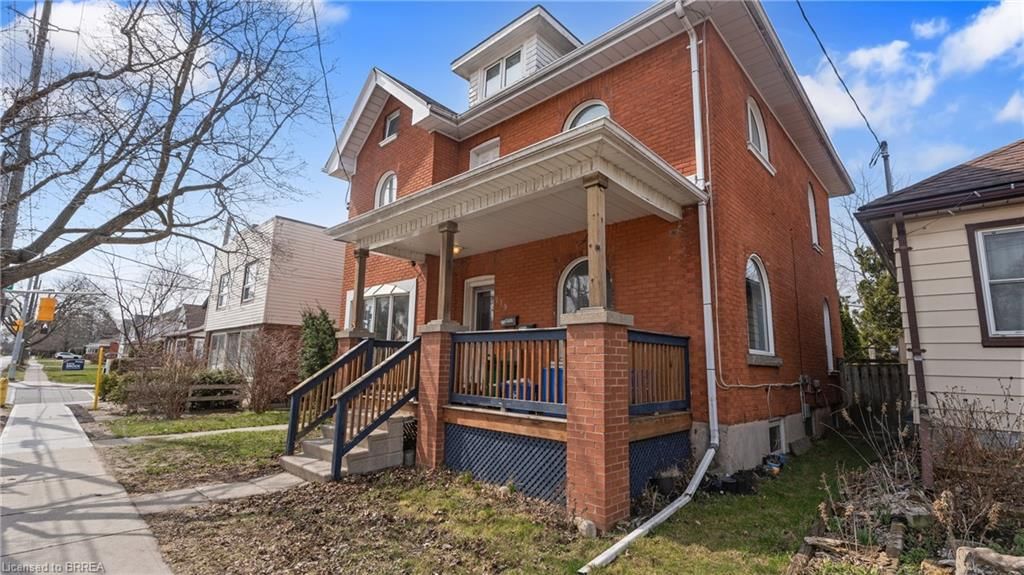
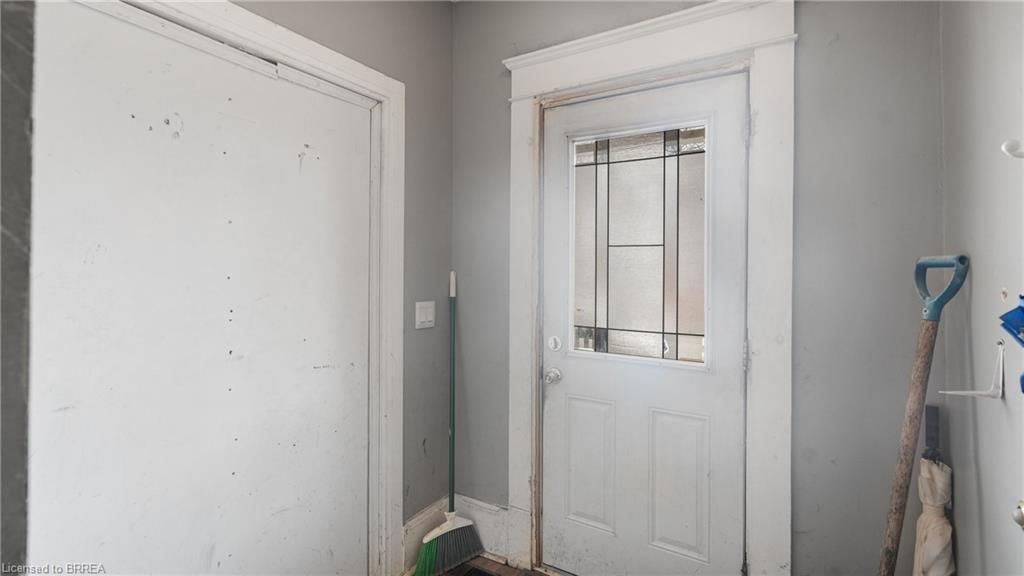
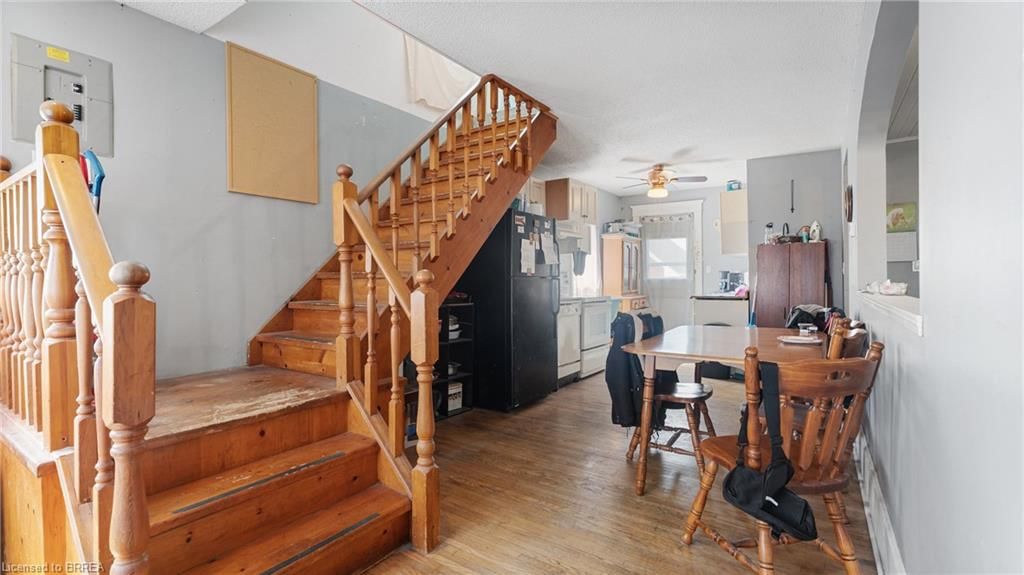
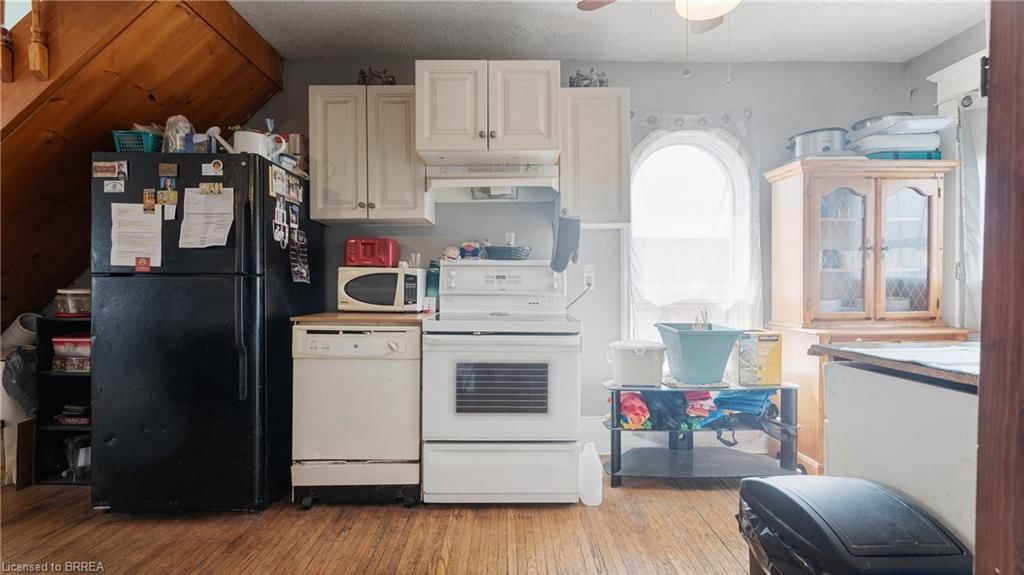
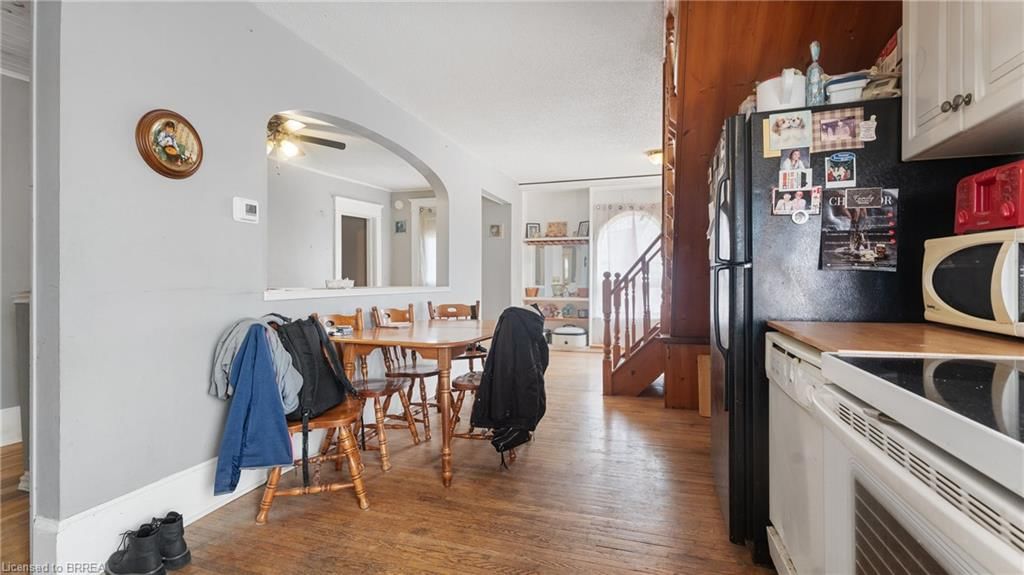
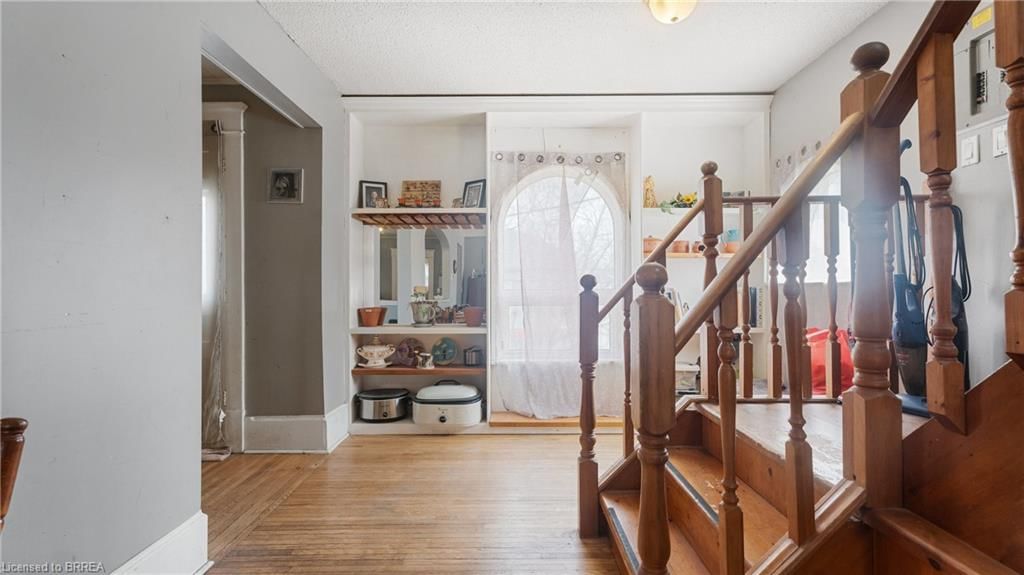
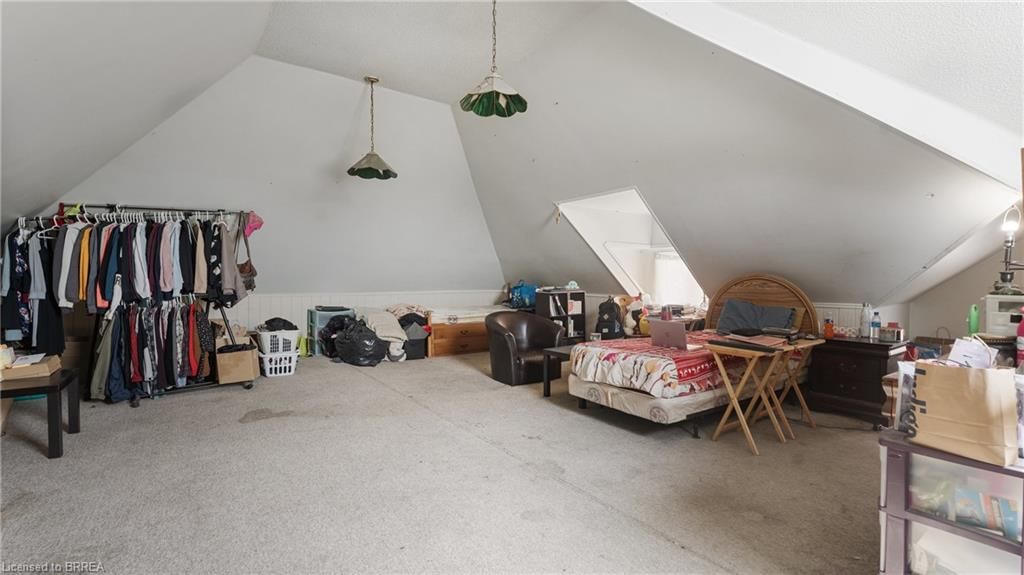
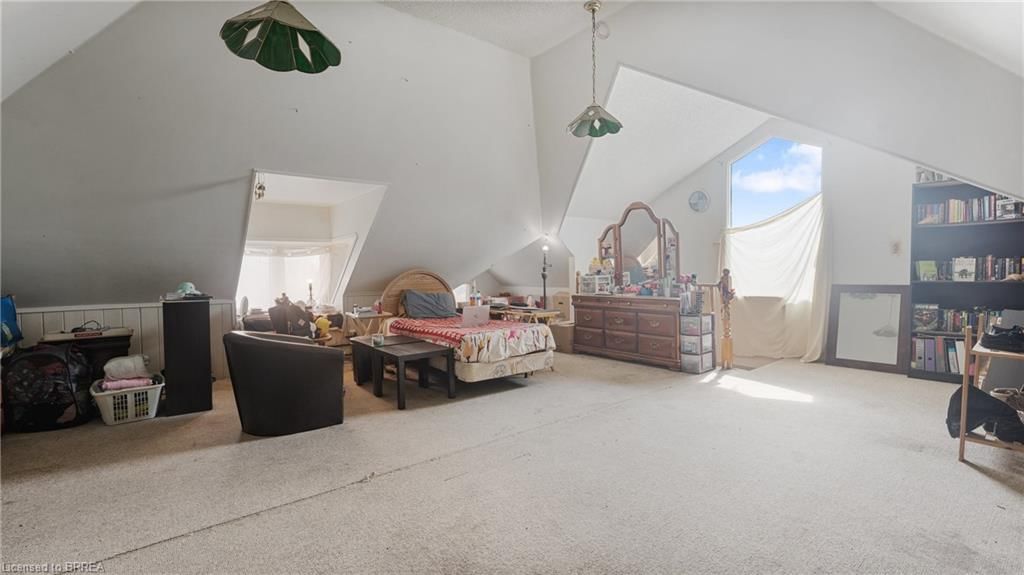
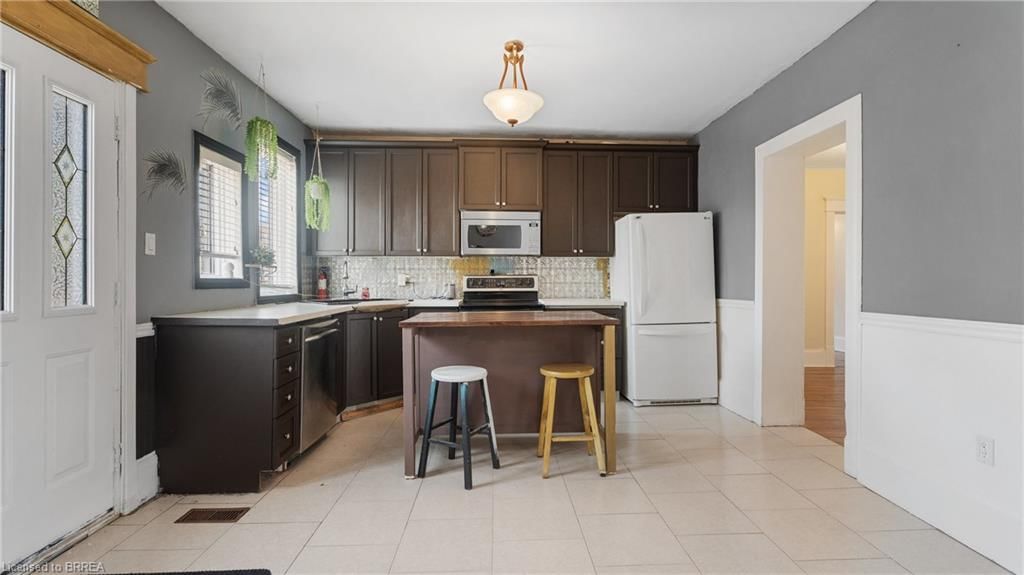
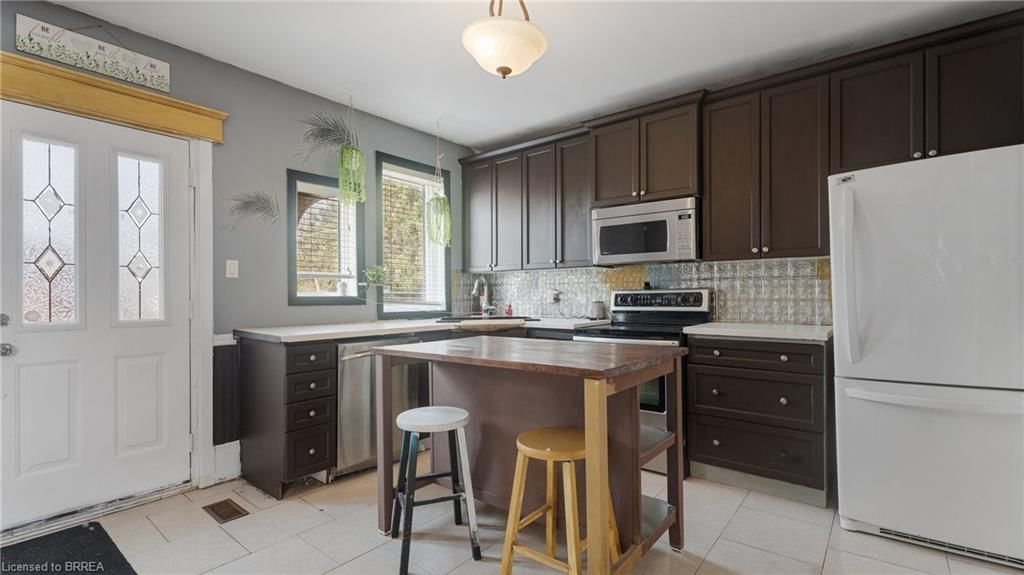
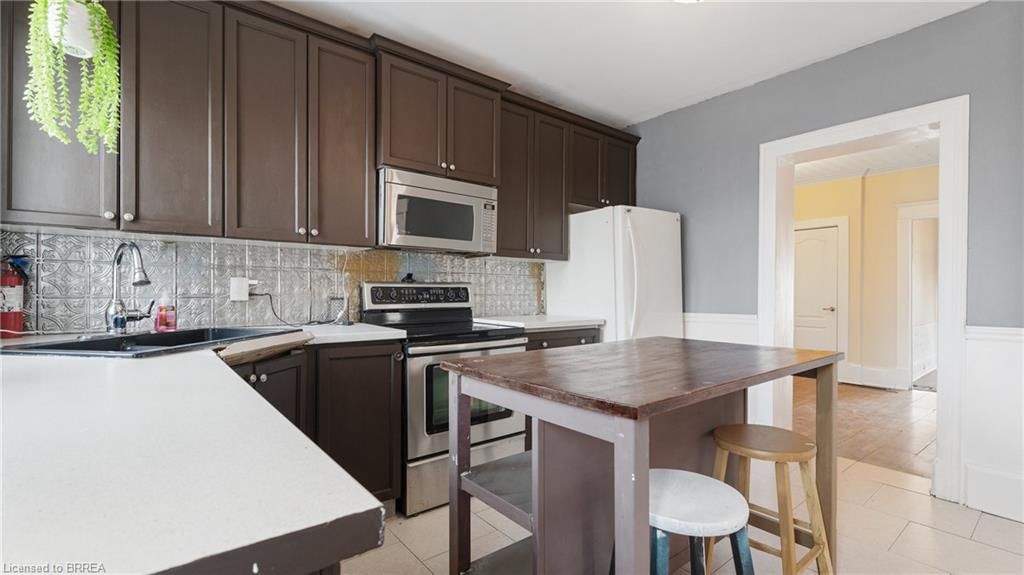
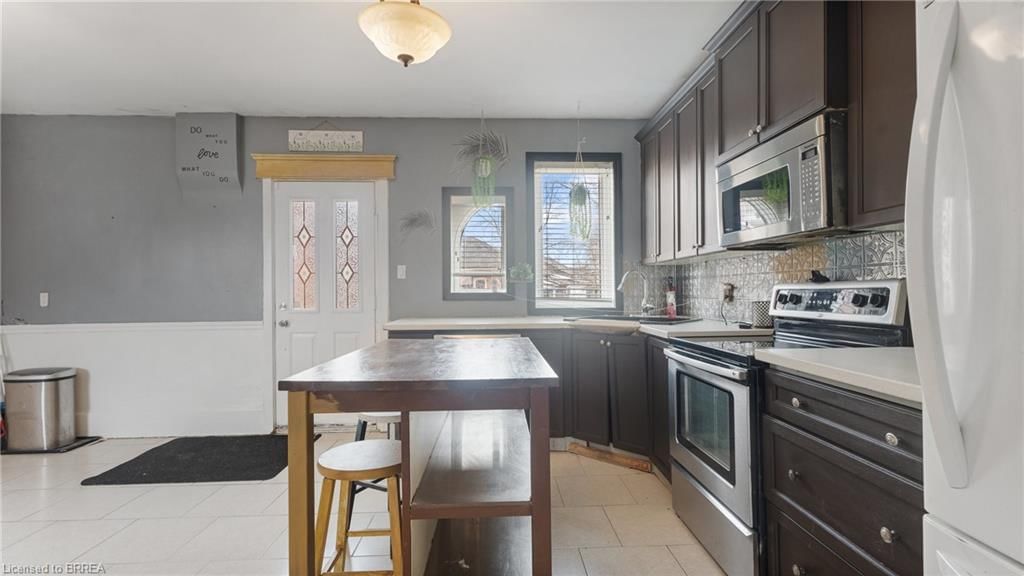
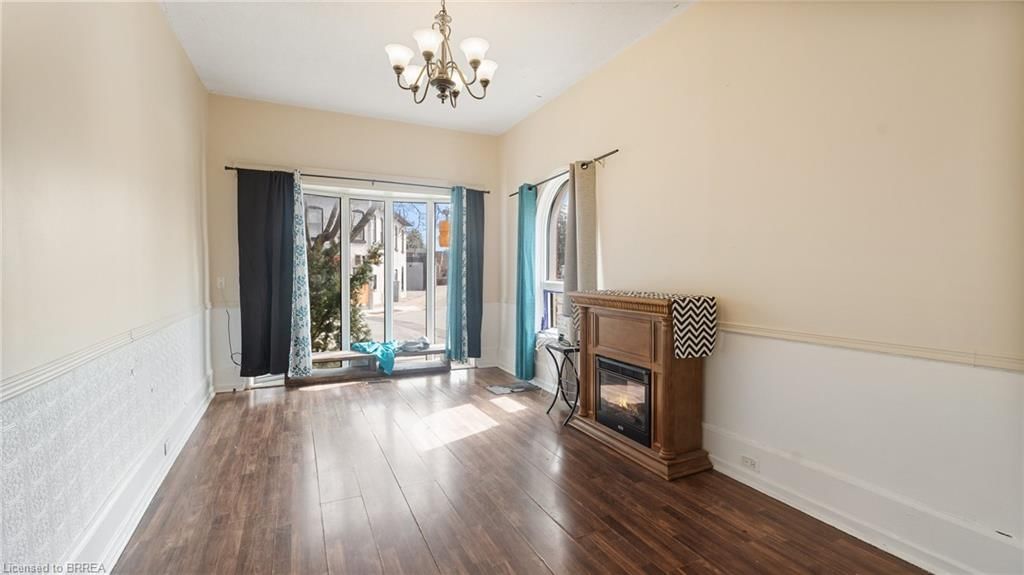
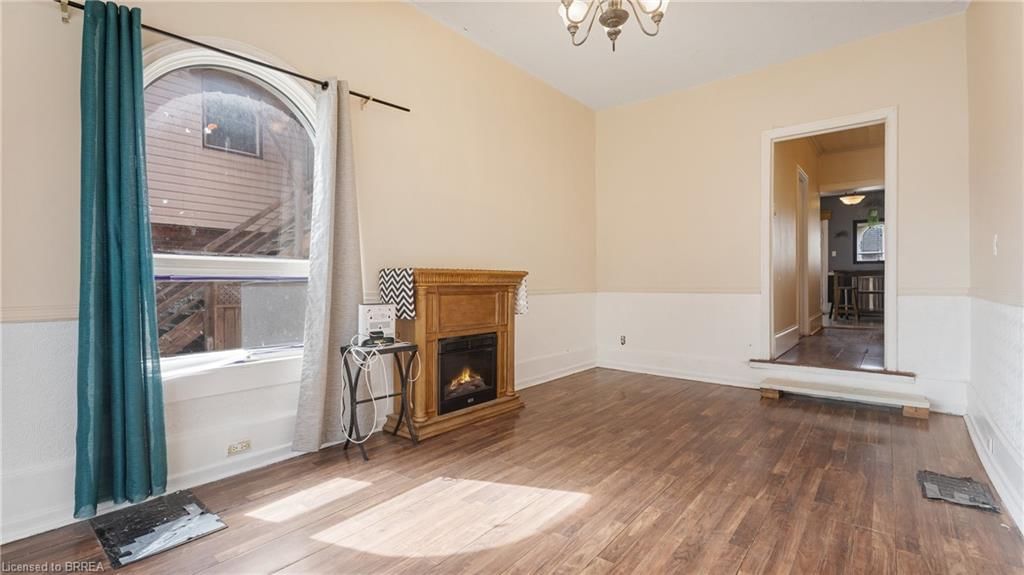
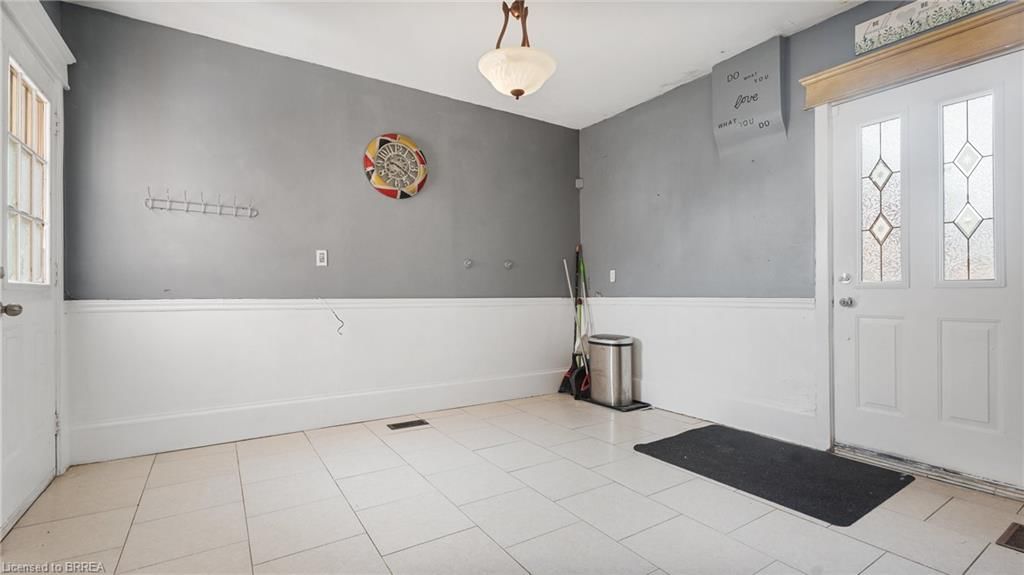
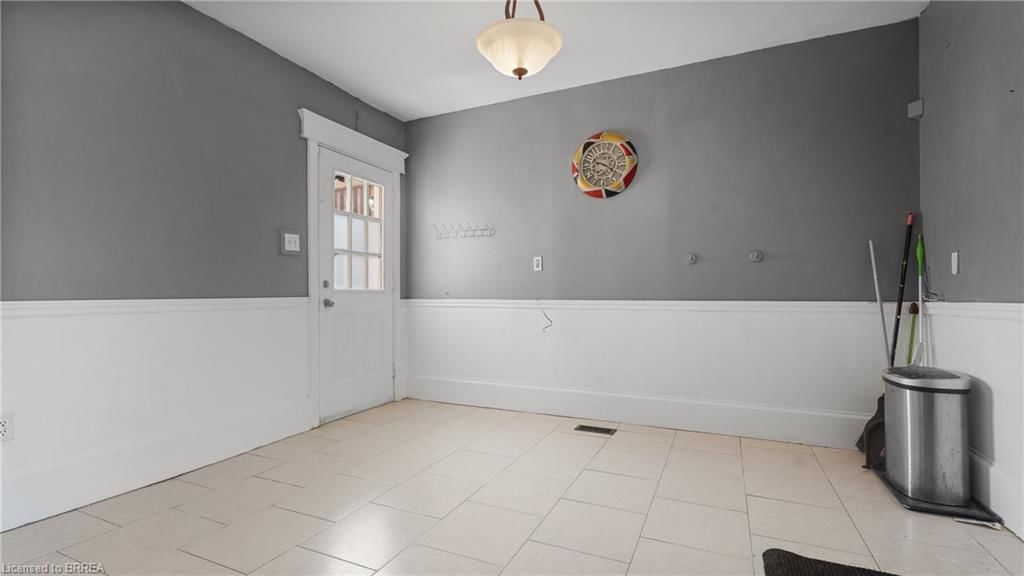
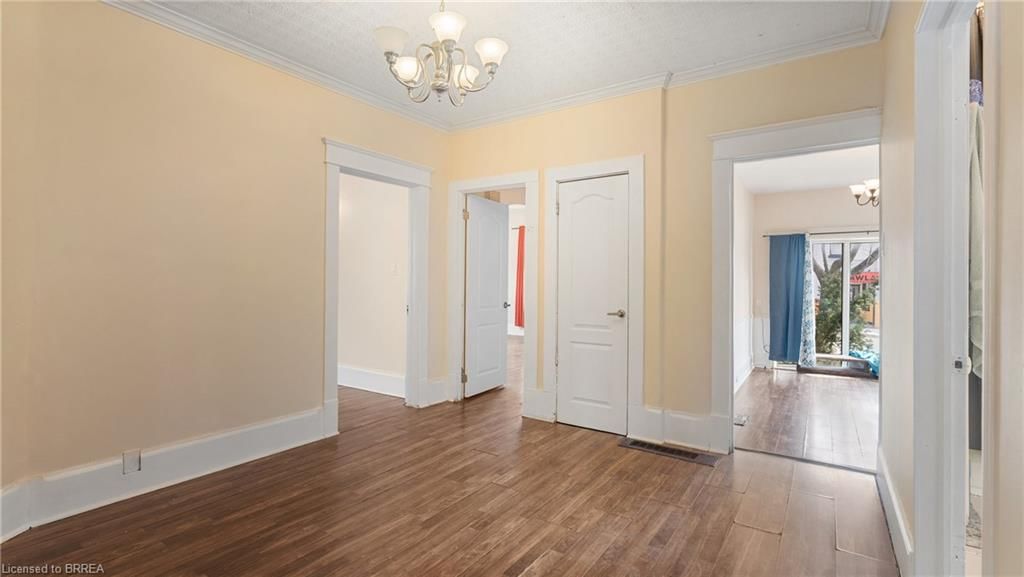
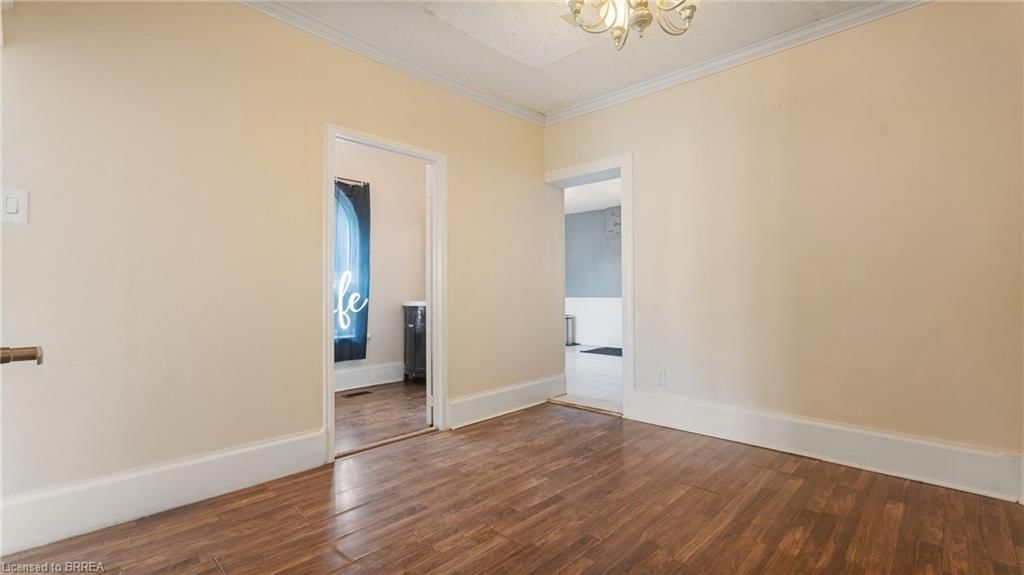
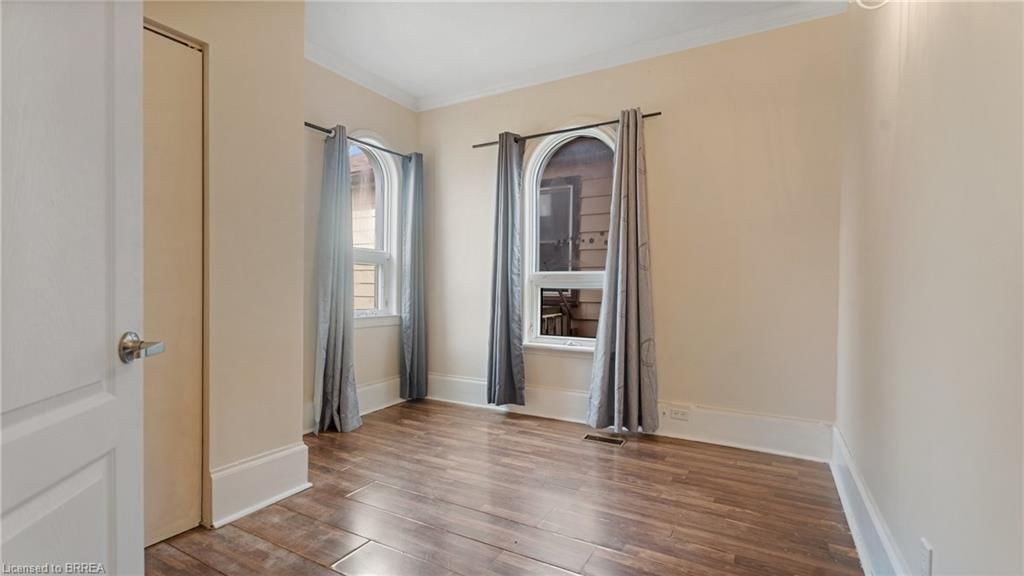
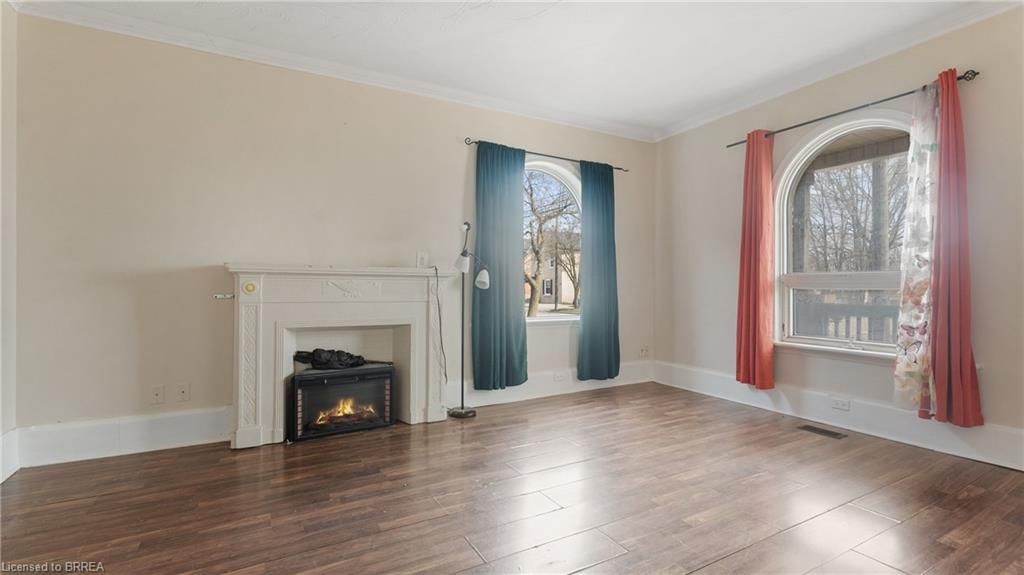
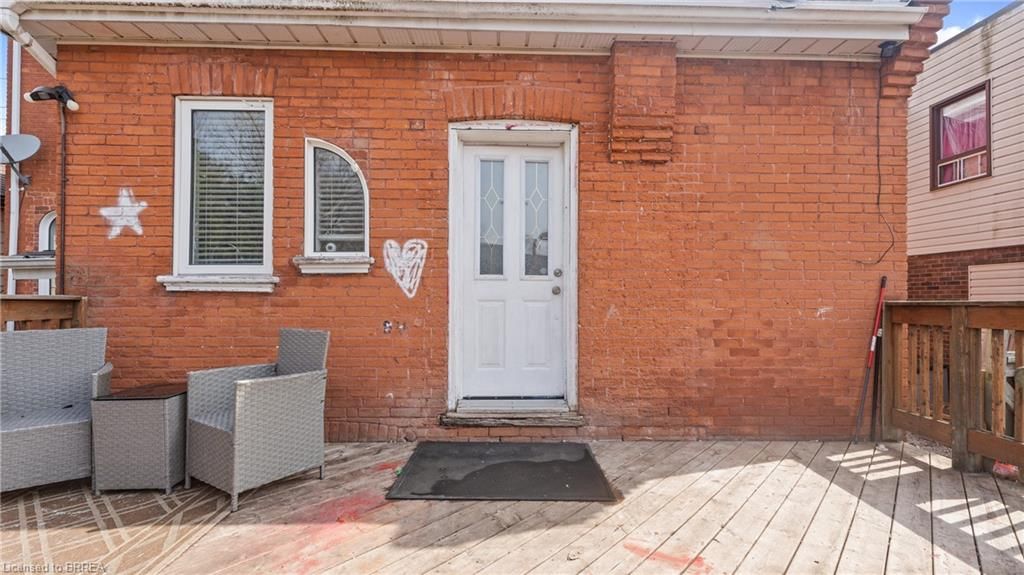
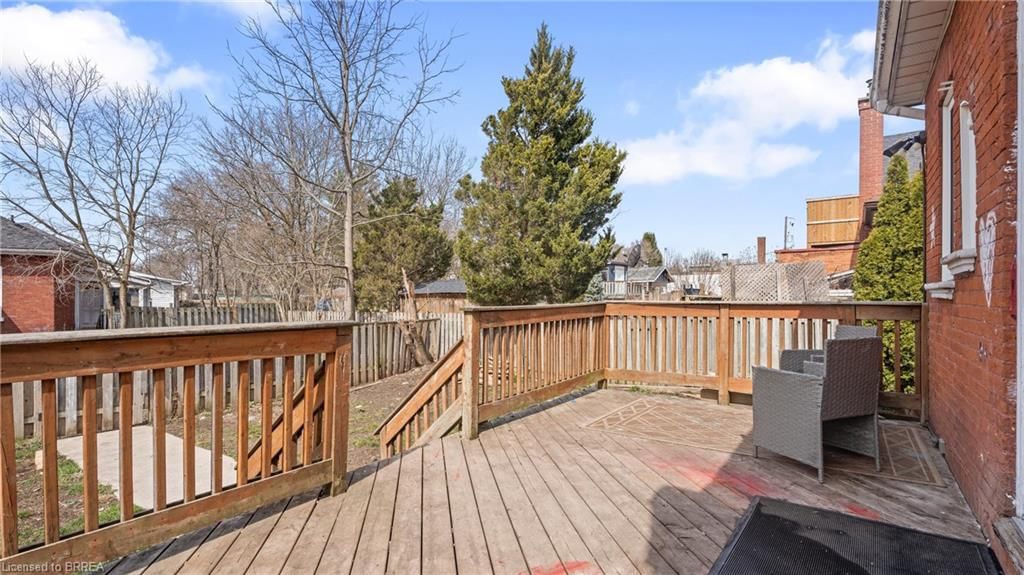
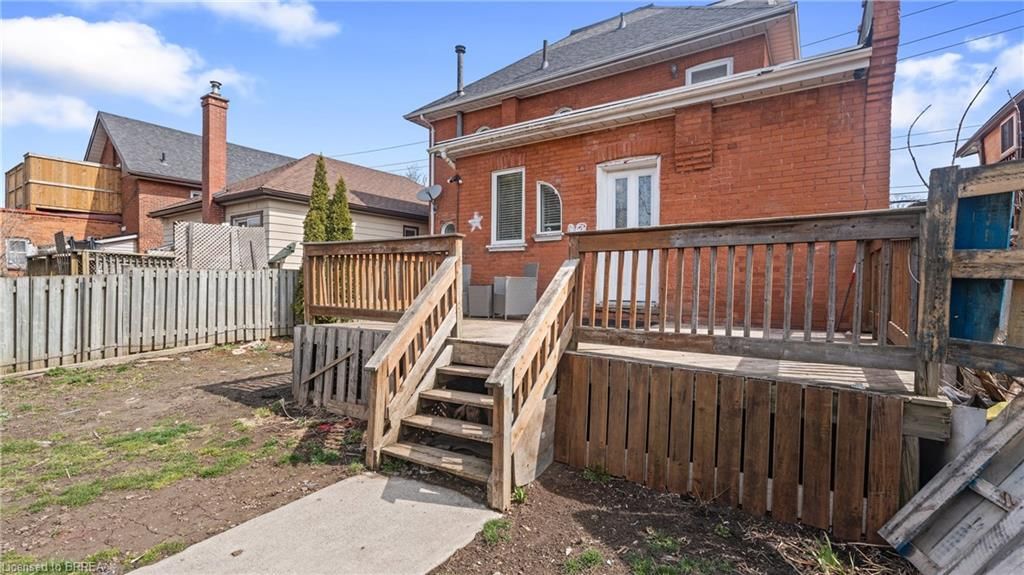
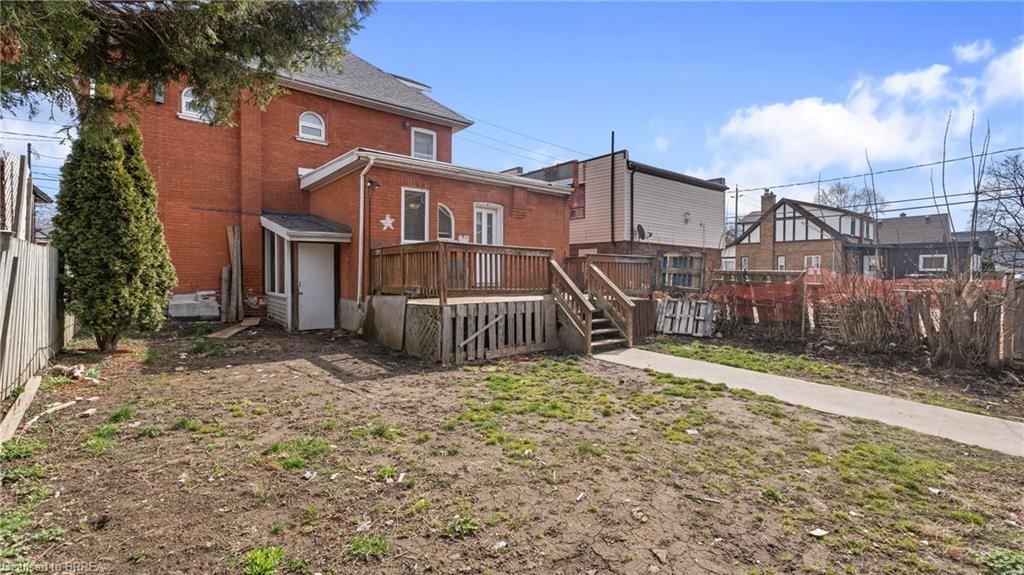
Opportunities like this, don’t come around too often.. Welcome to 219 Erie Ave in the extremely popular town to live in, invest in, raise a family in or grow old in, beautiful Brantford City. When you talk about a property that is ‘larger than life’ this is the one you use as an example. As soon as you drive by and park your car, you look up, and up and up because it seems to never end. It’s massive, and that’s only the second biggest part of this house. The potential is the biggest draw here… talk about unlimited potential. Finished from the basement allll the way to the third story loft, giving you over 3000 square feet to work with. This property effortlessly becomes, well anything you can think of. Want to add another unit? The basement is just waiting for it. Oh, and yes, there’s a separate entrance! On the main level there is a full unit equipped with kitchen, dining, living, a bed and bath. Access to the basement and a patio off the back. On the upper level there’s another full kitchen, breakfast nook, 3 bedrooms and bathroom. The primary bedroom is a MASSIVE wide open third story loft. See, I told you, the potential is truly unlimited and all it needs is YOU.
Dishwasher,Dryer,Refrigerator,Stove,Washer
Copyright 2025 Information Technology Systems Ontario, Inc. The information provided herein must only be used by consumers that have a bona fide interest in the purchase, sale, or lease of real estate and may not be used for any commercial purpose or any other purpose.
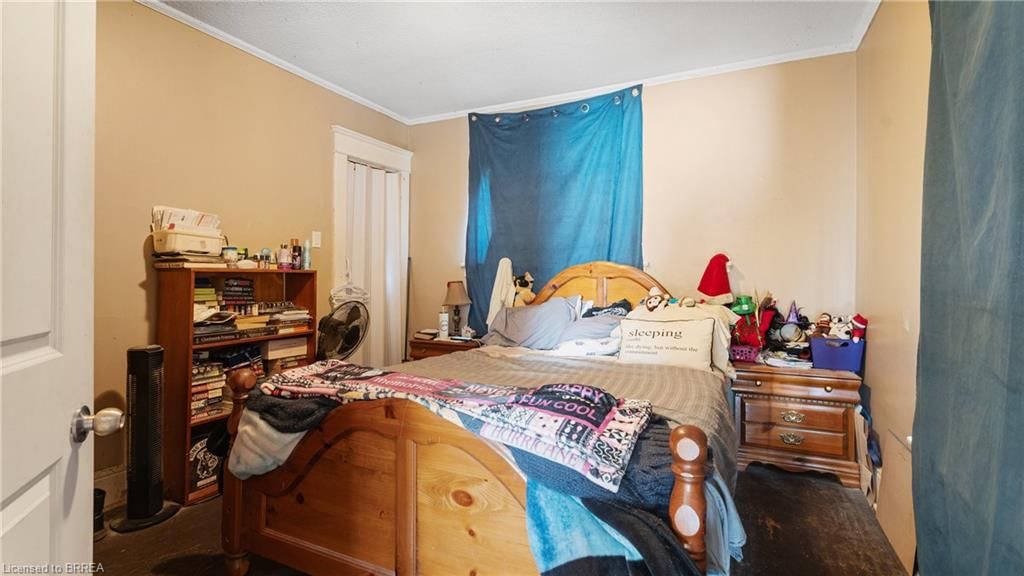
Bedroom
Dining Room
Kitchen
Bedroom
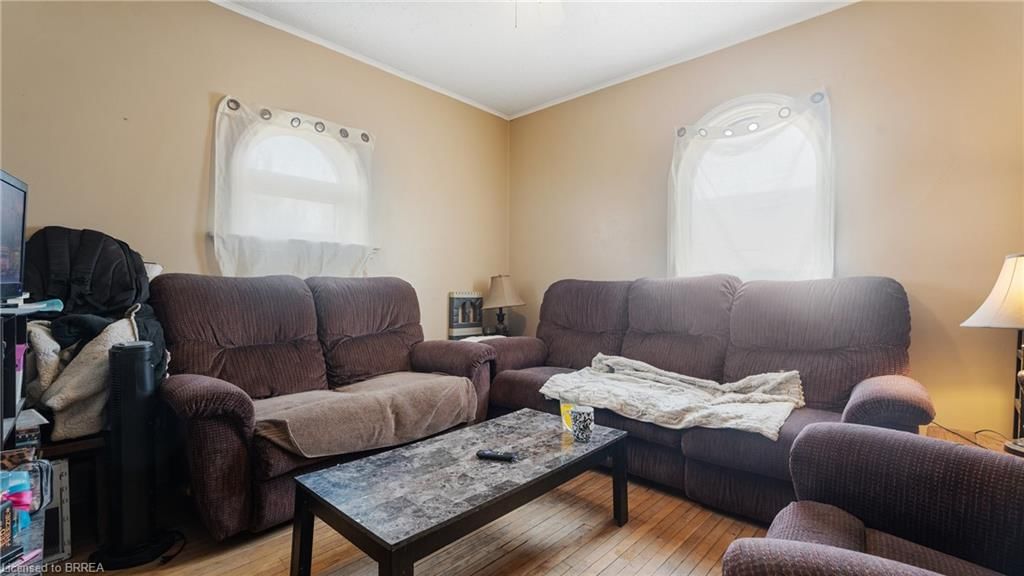
Living Room
Bedroom
Bedroom
Kitchen
Living Room/Dining Room
Recreation Room
Loft
Bonus Room
Bonus Room
Laundry
The graph below compares the average list price and average sale price of homes in this neighborhood by month for the last 24 months. When average sale price is greater than average list price, this may suggest a buyer's market. When average sale price is lower than the average list price this may suggest a seller's market.
The graph below illustrates the average days on market for homes in this neighborhood. The yellow area may indicate a buyer's market, the green area may indicate a balanced market and the red area may indicate a seller's market.
Sales Representative, Century 21 People’s Choice Realty Inc., Brokerage
(647) 576 - 2100